Select a Pre-Trained Model
Our advanced Gradient Boosting and Random Forest models are pre-trained and ready to use! Choose from Kepler, TESS, K2, or Unified models. Simply click on a model card to load it.
Loading available models...
Choose a pre-trained model from the "Choose Model" tab to enable predictions. You can still enter data below, but you'll need to load a model to get predictions.
Manual Data Entry
Enter the measurements for a single exoplanet candidate:
Batch Predictions (Upload CSV)
Upload a CSV file with multiple observations:
Drag & drop your CSV file here or click to browse
Selected file:
Train Your Own Custom Model
Experiment with different hyperparameters to train a custom model! Adjust the settings below and click "Train Model" to create your own model. This will take 2-5 minutes.
Step 1: Choose Algorithm
Step 2: Choose Dataset
Step 3: Adjust Hyperparameters
Step 4: Start Training
Training typically takes 2-5 minutes depending on parameters.
Train a model to see performance metrics and visualizations.
Model Performance Visualizations
Visual References - How Our AI Works
These diagrams explain how our machine learning algorithms identify exoplanets from telescope data.
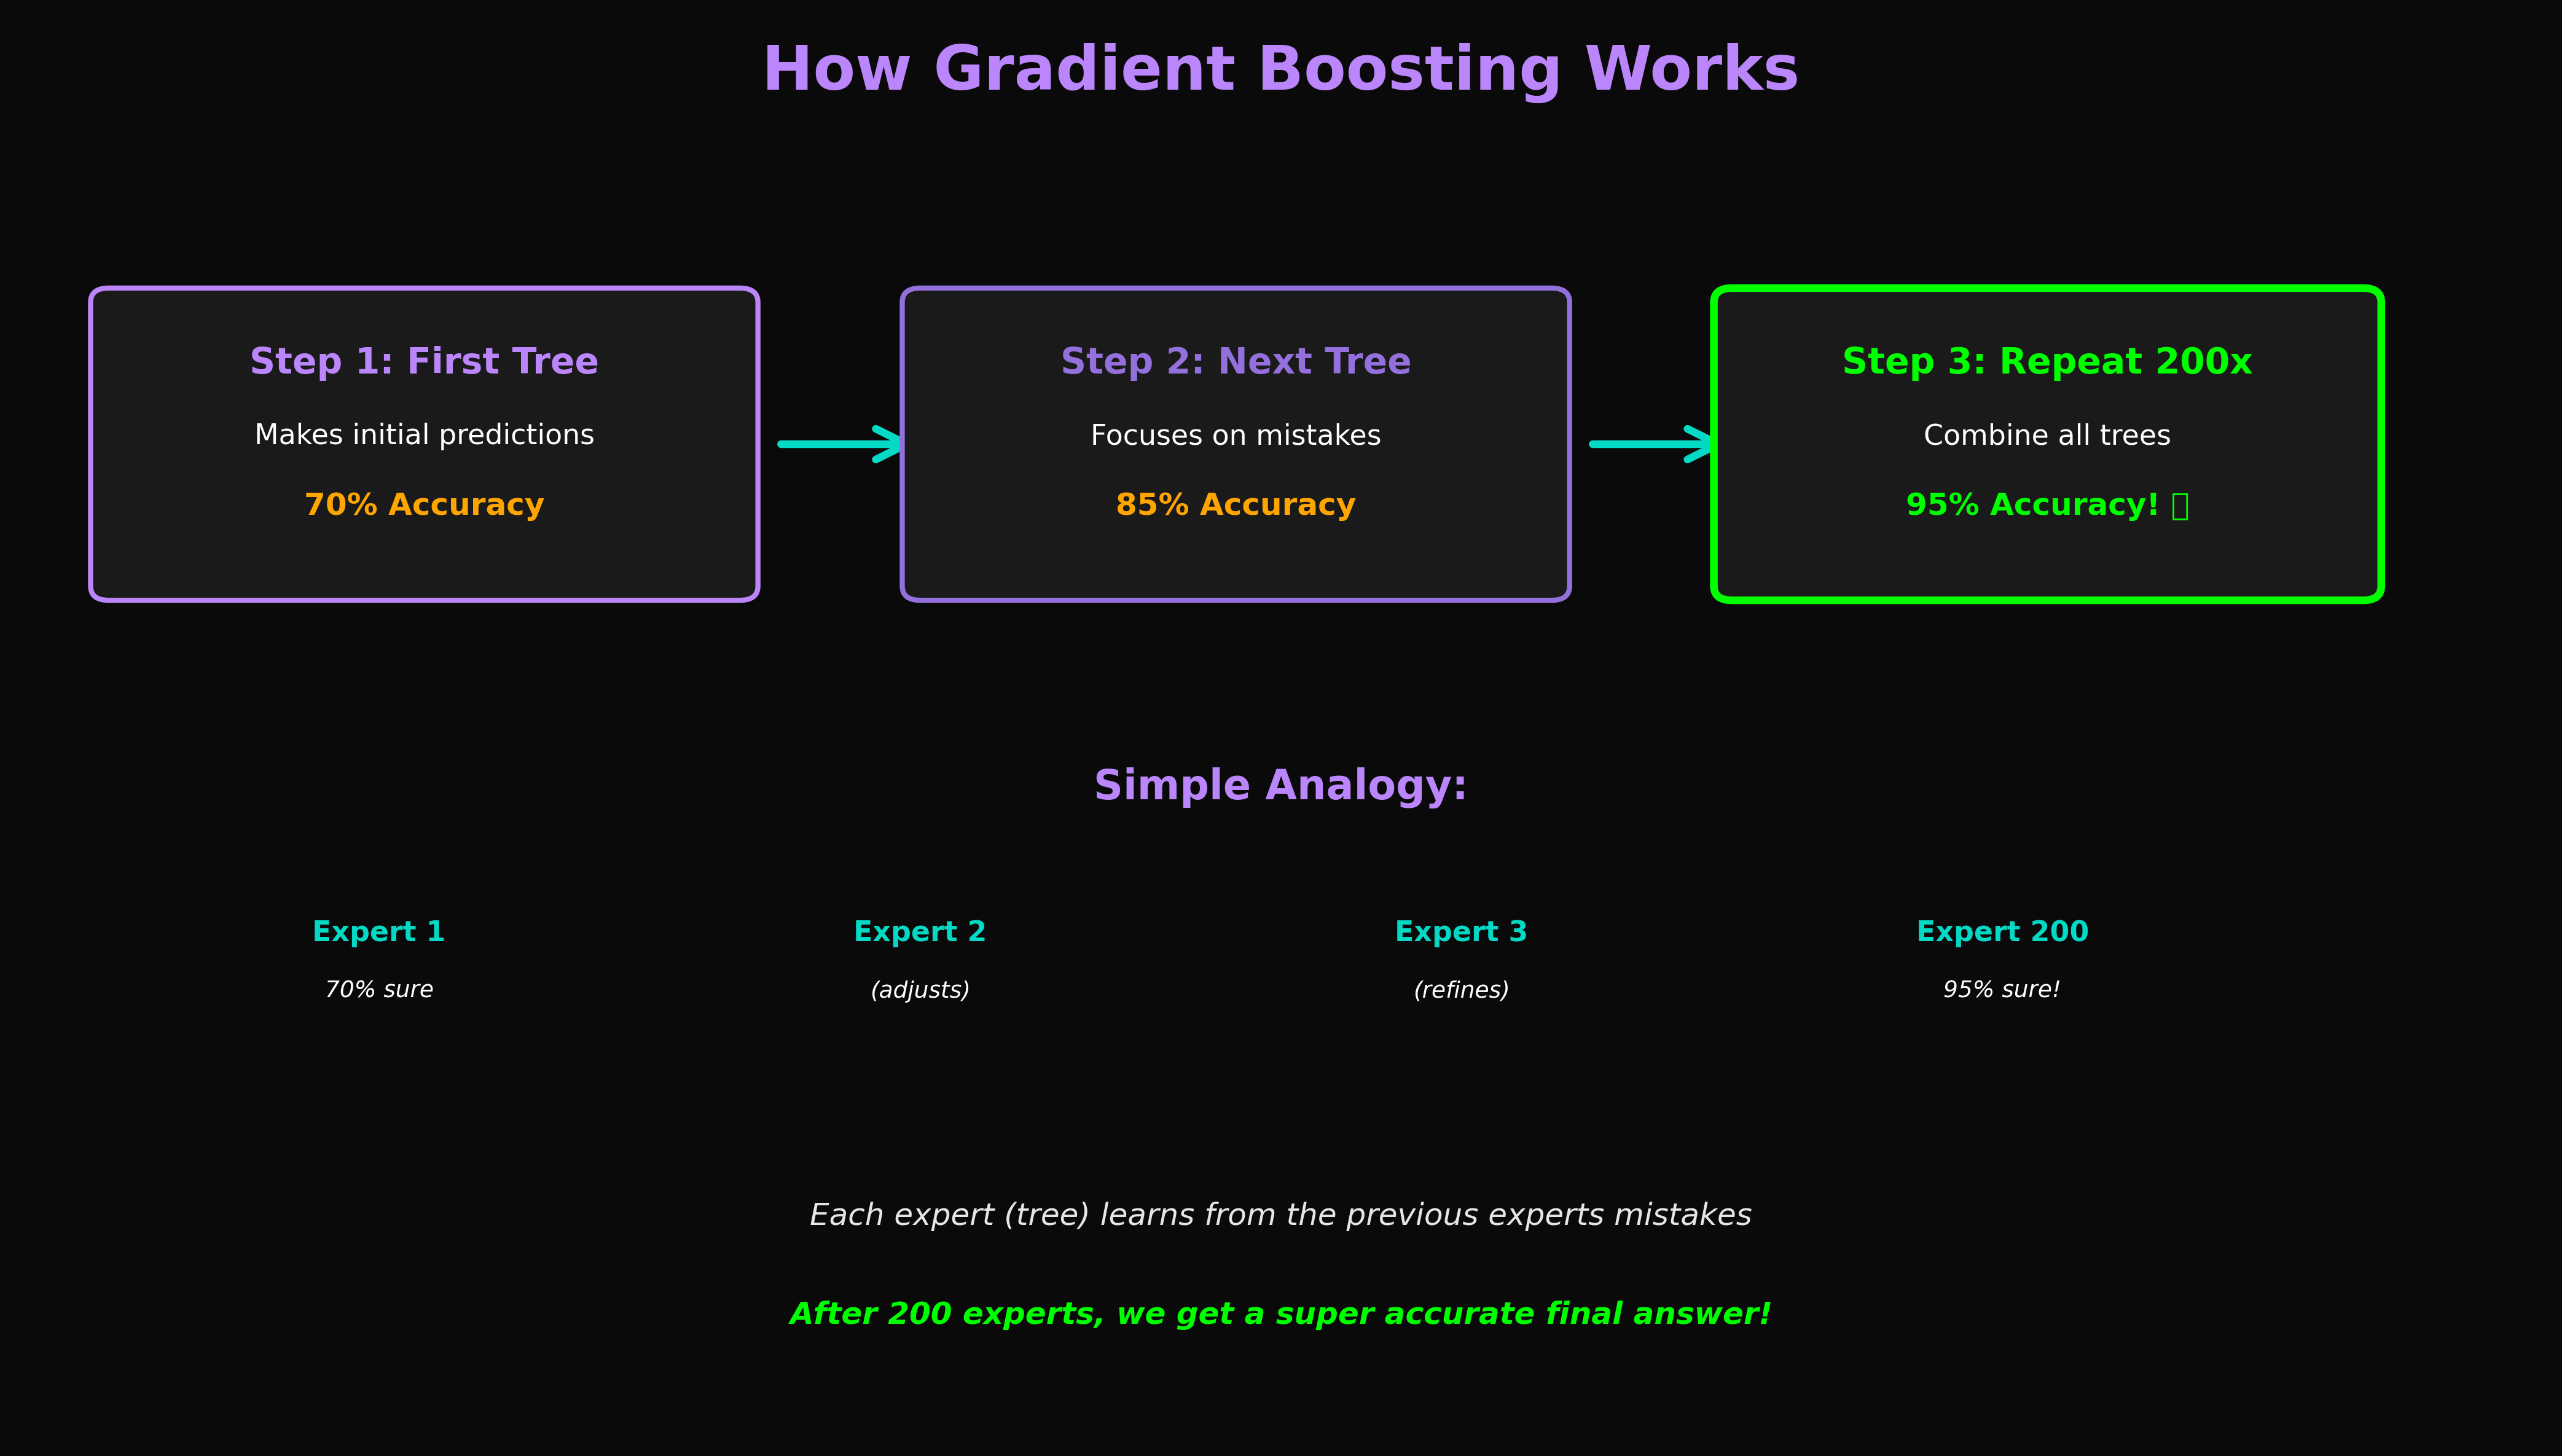
How Gradient Boosting Works
Step-by-step process showing how Gradient Boosting improves accuracy by learning from previous mistakes. Each iteration builds on the last to achieve 75.85% accuracy on Kepler data.
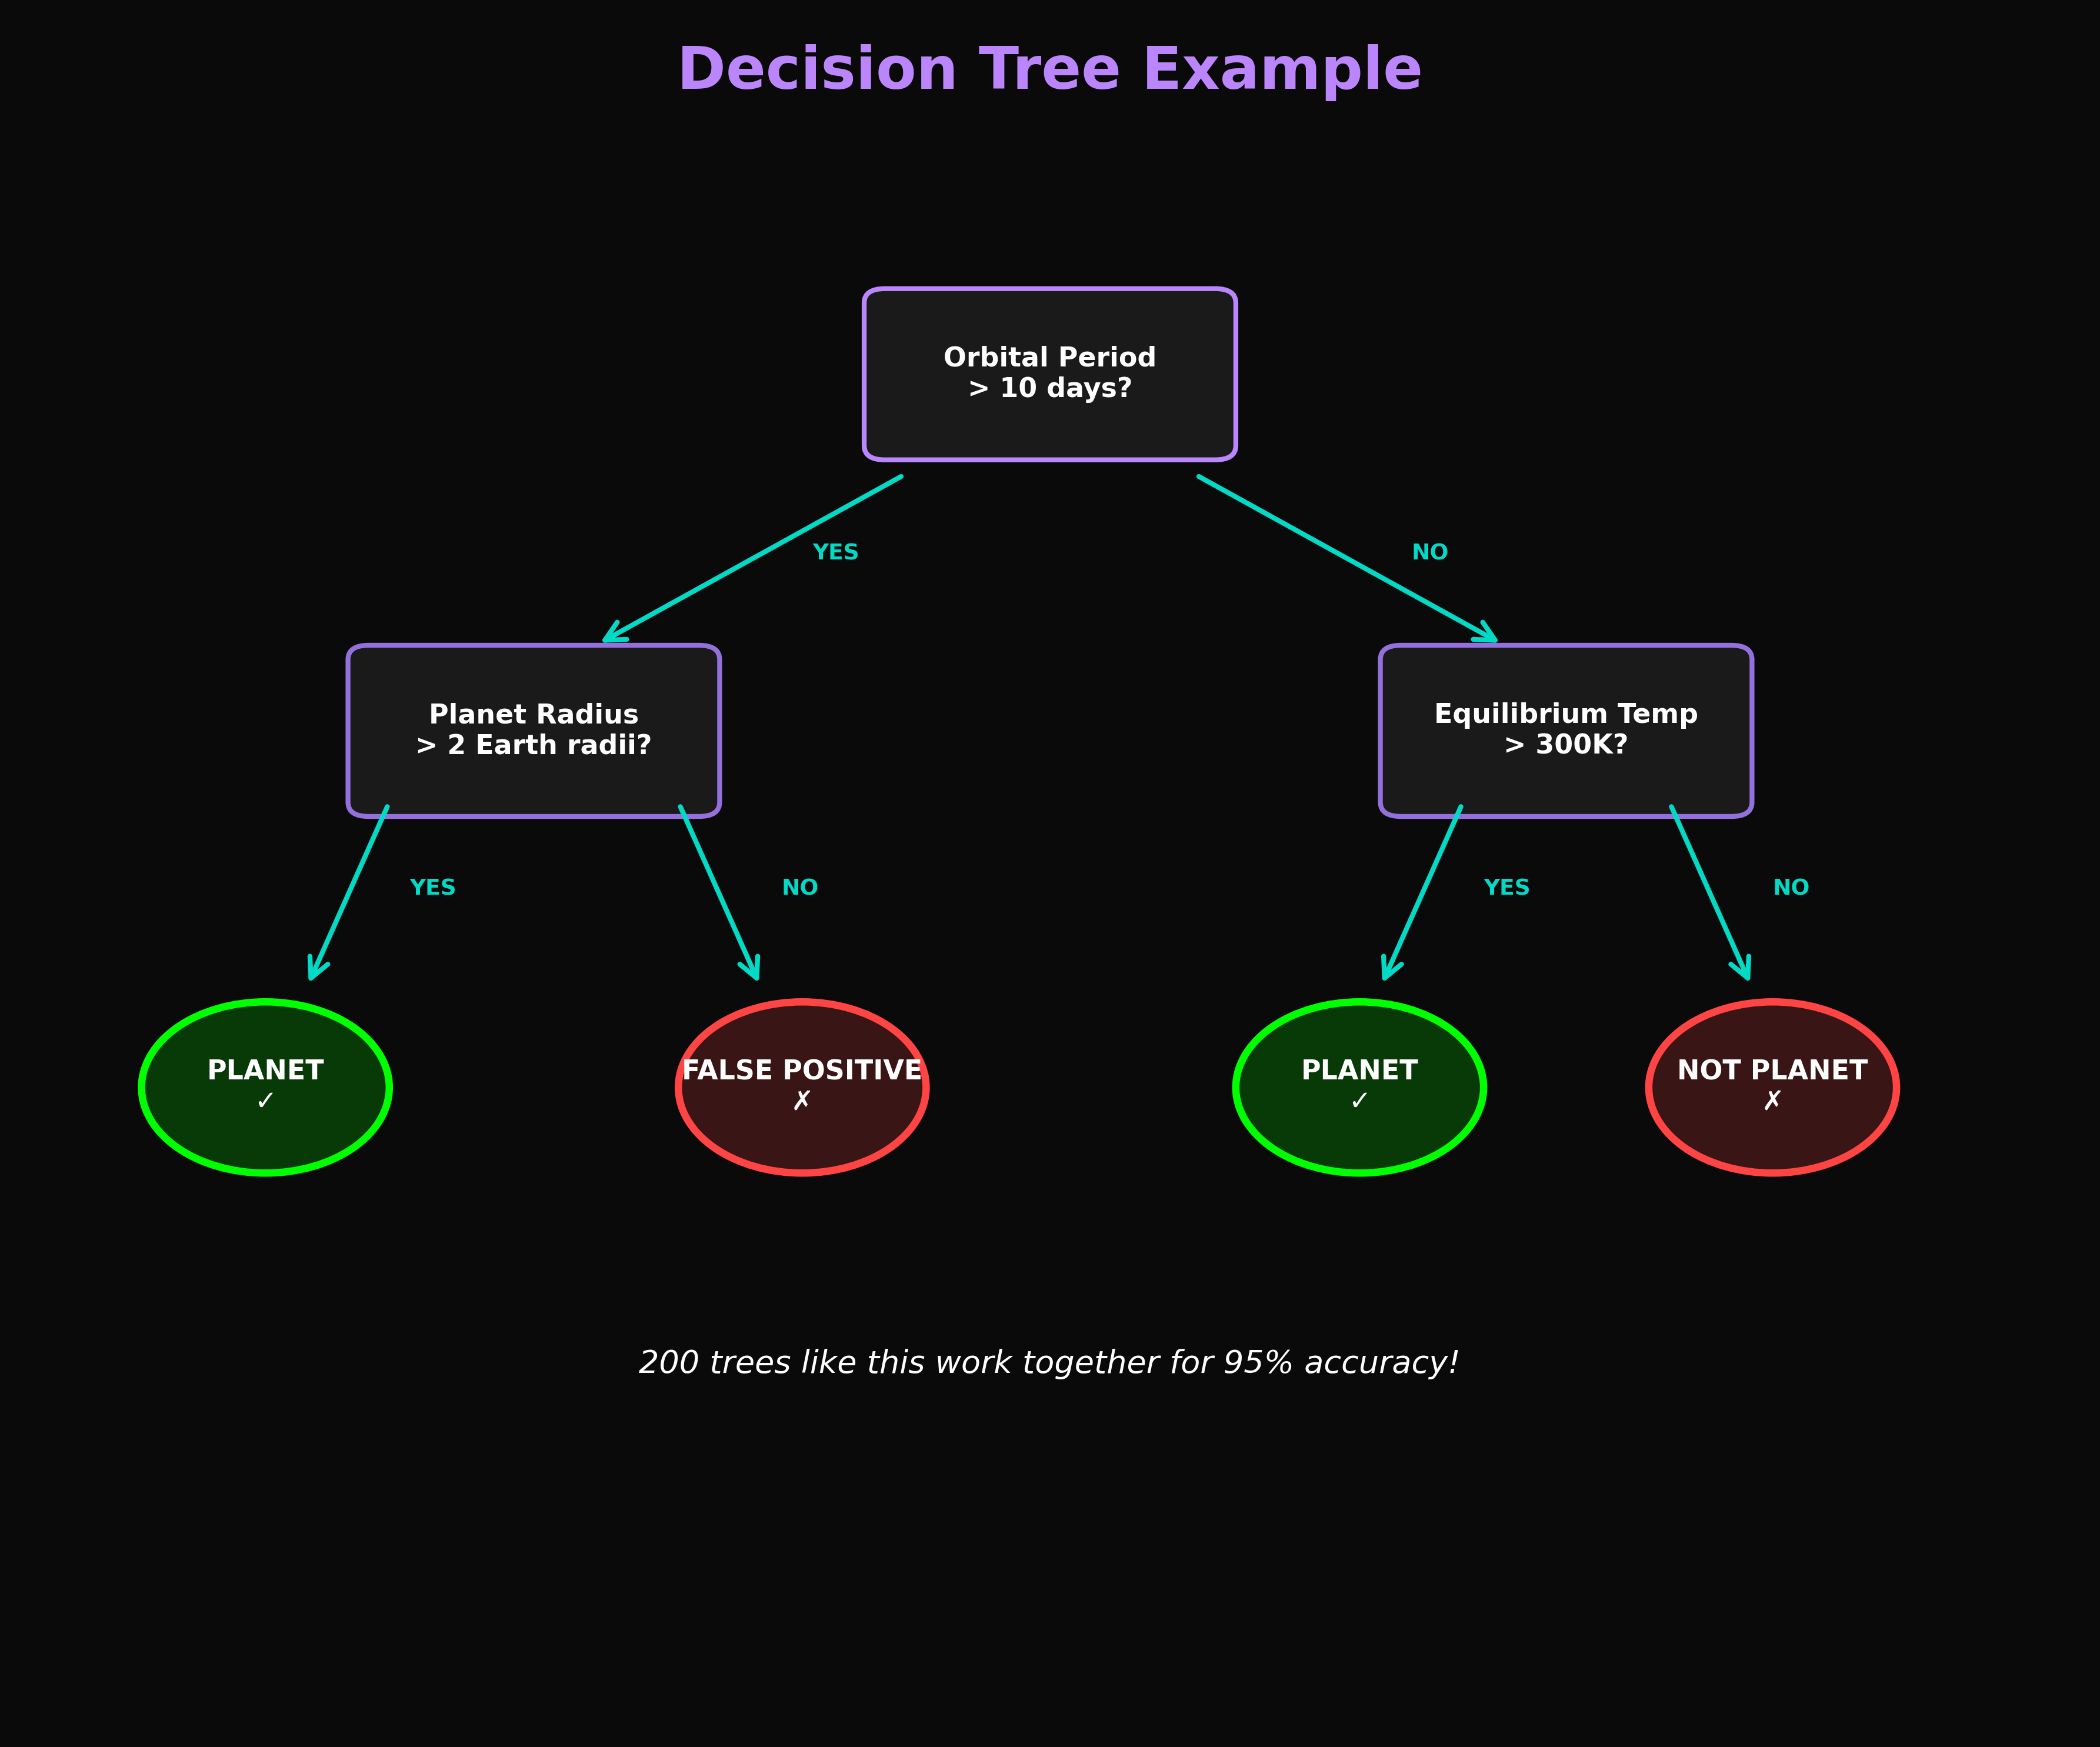
Decision Tree Example
Visualization of how a single decision tree makes classification decisions based on exoplanet features like orbital period and transit depth.
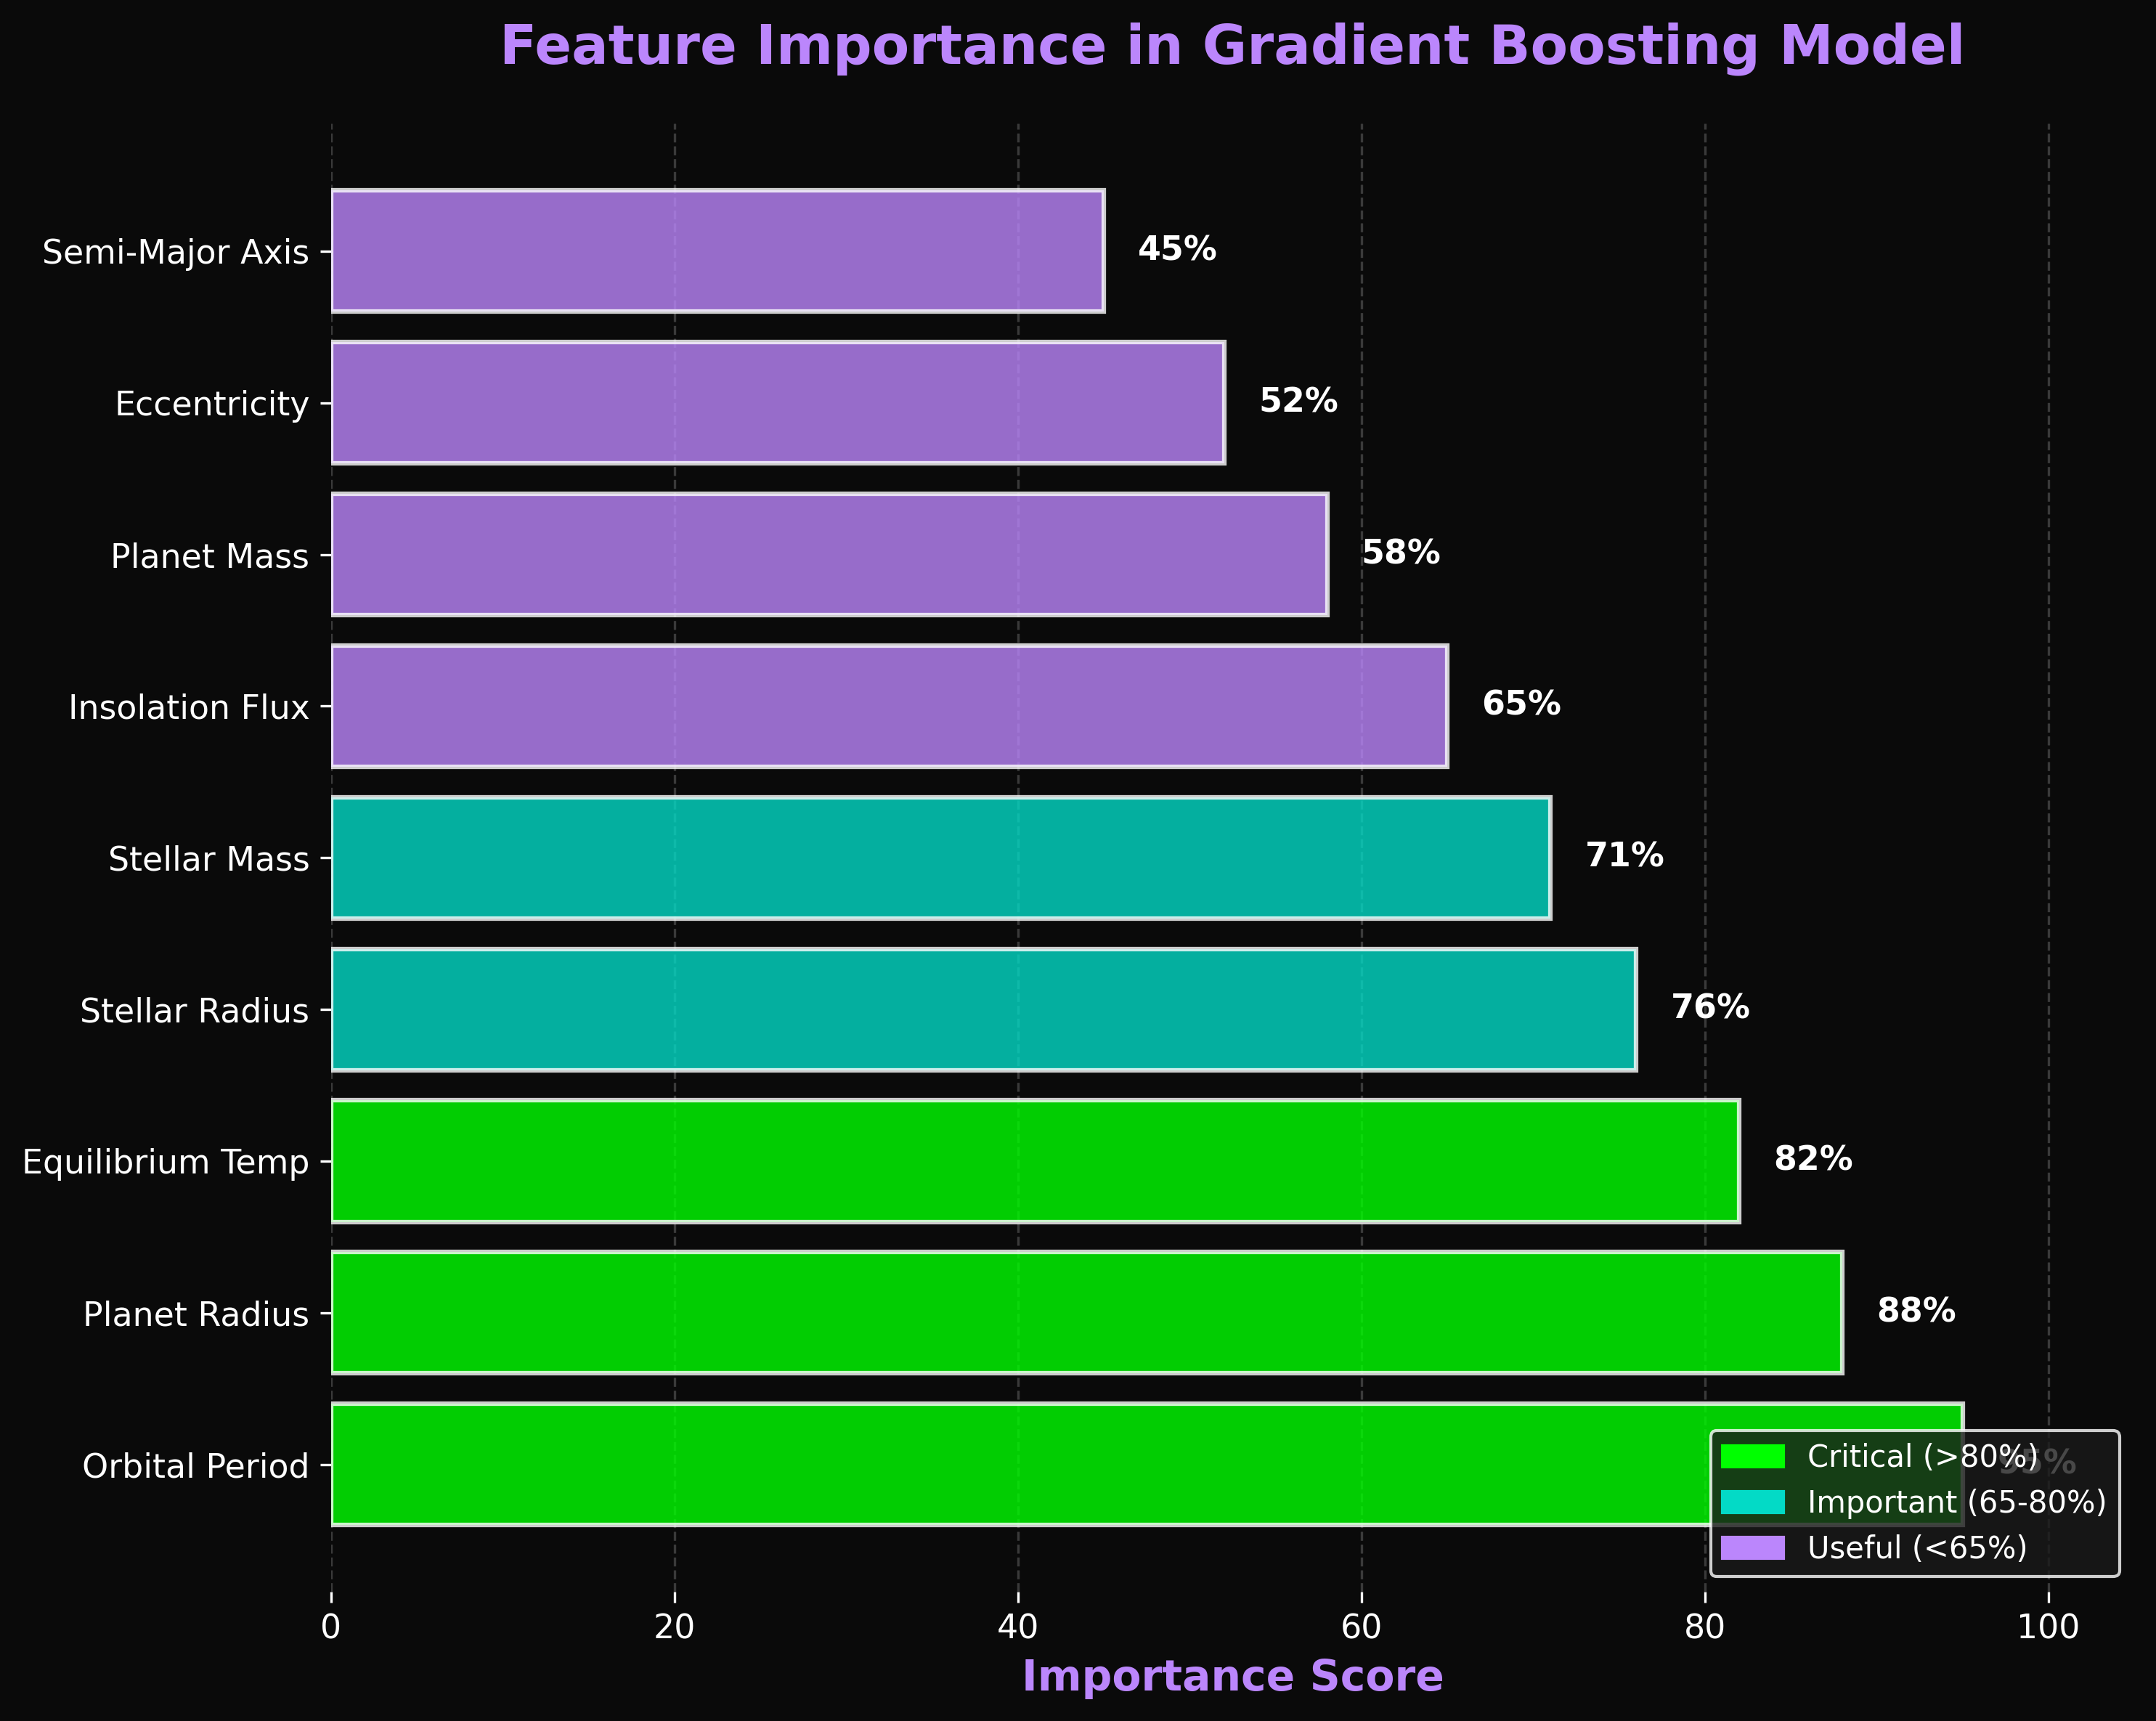
Feature Analysis
Key features our models use to identify exoplanet candidates. Shows which measurements are most important for accurate predictions.
Understanding the Metrics
🎯 Accuracy
What it means: The percentage of predictions that were correct.
Example: If accuracy is 95%, the model correctly identified 95 out of 100 cases.
Why it matters: Shows overall performance, but can be misleading with imbalanced data.
🔍 Precision (ML Definition)
What it means in ML: Of all the signals the model labeled as "exoplanet," what percentage were ACTUALLY exoplanets?
Formula: Precision = True Positives ÷ (True Positives + False Positives)
Example: 90% precision means that out of 100 things the model called "exoplanet," 90 were real exoplanets and 10 were false positives.
Why it matters: High precision = fewer wasted telescope observations on false alarms!
Note: In general science, "precision" means reproducibility (same input → same output). In ML, it specifically measures how reliable positive predictions are. Our models are also deterministic (same input always gives same prediction).
🔎 Recall
What it means: How many real exoplanets did the model actually find?
Example: 85% recall means the model found 85 out of 100 real exoplanets.
Why it matters: High recall means we're not missing many discoveries!
⚖️ F1-Score
What it means: The balance between precision and recall.
Example: If precision is 90% and recall is 80%, F1 is around 85%.
Why it matters: Best single metric for overall performance!
How the Models Work
🌲 Random Forest
Think of it like asking hundreds of experts for their opinion, then going netstat -tuln | grep 5000 with the majority vote. Each "expert" is a decision tree that looks at the data differently.
How it works: The model creates many decision trees (a "forest"). Each tree makes its own prediction, and the final answer is based on what most trees agree on.
Strengths: Good at handling messy data and doesn't get easily fooled by outliers. Works well even when some data is missing.
🚀 Gradient Boosting
This one learns from its mistakes. It builds decision trees one at a time, where each new tree tries to fix the errors made by previous trees.
How it works: Start with a simple prediction, see where it's wrong, build a new tree to correct those mistakes, and repeat. Each tree makes the overall model a bit smarter.
Strengths: Usually gives the best accuracy because it keeps improving itself. Our Gradient Boosting Kepler model hit 75.85% accuracy - the highest we've achieved!
📊 About the Datasets
Kepler: Data from NASA's Kepler space telescope (2009-2013). Includes things like orbital period, transit depth, planetary radius, and properties of the host star.
TESS: Data from NASA's TESS satellite (2018-present). Focused on finding planets around nearby bright stars that are easier to study.
K2: Extended Kepler mission data with different target fields across the sky.
What we predict: Whether a signal is a confirmed exoplanet, just a candidate that needs more study, or a false positive (not actually a planet).